
Pioreactor development log #1

💡 Going forward, we'll try to write weekly blog posts with details about interesting additions, challenges, and ideas we have while building the Pioreactor. This week we talk about a new user-interface for self-tests, and reducing noise in our optical density signals.
Building confidence
My first 3D printer, a Prusa Mini, arrived in hundreds of pieces - designed as a build-it-yourself kit. And while the instructions were excellent, it was still an intimidating task: there were lots of moving parts held together by belts, high temperature hotends, and electrical components. After finishing the last step and powering up the printer, I was greeted with the Prusa Mini's self-test. It was a simple routine that tested the different components: moved the belts, heated and cooled components, and checked sensors. At the end of the routine, I saw 100% green check marks:
This might sound simple, but from a user's point-of-view, I was delighted. Delighted not only because it was my first experience with the printer, but also because it gave me the feeling of confidence that I could proceed and not have to worry about the build anymore¹. Now, when I make upgrades to the printer, I still run the self-test to gain back that confidence.
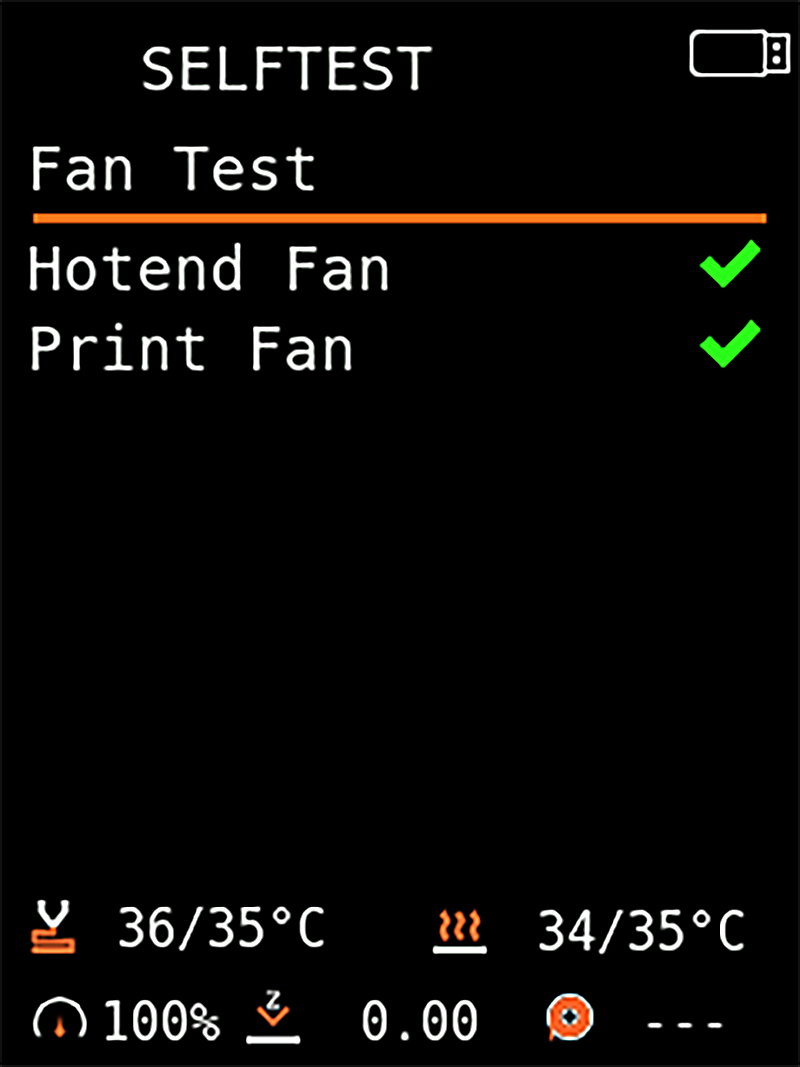
Even with my own expertise in Pioreactors, I want that sense of trust in my Pioreactor projects. Are the LEDs in the right position? Did I attach the stirring motor correctly? To build that trust, we've implemented a self-test for the Pioreactor, available in the UI:


Similar to the Prusa's test, we sequentially test important components of the bioreactor, and report back to the user the result.
I'm really happy with this addition to Pioreactor. We can also use this to add more hardware tests in the future, too.
Variance reduction in our optical density signal
We've been trying the understand all the sources of noise in our most important signal, optical density. Recall that we use the principle of scattering to measure optical density: an infrared LED emits straight into the vial, light is scattered off cells, and a photodiode detects the amount of light. For most purposes, the photodiode measurement is proportional to the density of cells. However, our photodiode measurement contains noise. We can distinguish between biological noise (example: noise caused by the morphology of cells), mechanical noise (example: noise caused by a continuously mixed environment), and electronic noise. The latter is what we are interested now.
What are the known sources of electrical noise we've uncovered?
- common mode current caused by nearby AC devices
- LED output varying, which changes the amount of light striking the photodiode. LED output varying can be caused by:
- temperature changes in the environment,
- current passing through the LED varies.
Common mode current will be addressed in a future blog post, but the varying LED output had a big win this past week. Our LEDs are controlled by an LED driver circuit, and at the start of that circuit is a digital-to-analog (DAC) chip, the DAC43608. The DAC's output is a voltage, which is later converted into a current that passes through the LED. It follows that any instability in the output voltage is a cause of noise in the LED's output. The DAC43608 we are using uses a reference voltage, call this Vref, that is proportional to the DAC's output voltage. For example, sending a command of 50% to the DAC will output a voltage of Vref * 0.5. Therefore, noise in the Vref will cause noise in the LED output. In the current Pioreactor, we use the RaspberryPi's 5V rail as the Vref.
I started seeing some strange problems during experiments. For example, during a database backup, the CPU is under a heavy load, and I would witness dramatic changes in the optical density measurement.

It turns out that the 5V rail isn't always 5V. It is only as stable at the power supply unit's stability, and if a lot of load is on the rail, it can dip quite a bit. Even with no load, and the RPi's CPU being as silent as possible, there is still noticeable variance in the 5V rail. And this was our DAC's Vref!
On the other hand, the 3.3V rail on the RPi is highly regulated, since it powers critical components on the RPi. Take a voltmeter to this rail, and it shows very little variance. So it was critical that we move the DAC's Vref from the 5V rail to the 3.3V rail.
Below is an example of the optical density signal using the 3.3V rail as reference, vs using the 5V rail. Notice the very large change in variance! That's a lot of noise we removed from the system.

Optical density signal with DAC using 3.3V rail (blue), vs 5V rail (red), in a stirred yeast culture. Looks pretty good!
Overall, we see about a 2x reduction in variance in our optical density signal. The ironic part is that because our signal has so much less noise now, we are noticing new sources of noise! Maybe for another article, though!
¹ I call this experience "climbing up the abstraction ladder". We move from reasoning about a low level implementation to strictly reasoning at a higher level.